How can i determine ROCOF in multi machines power system using PSS/E ?
i want to know how can i plot Rocof to study the effect of low inertia in a power system with hight integration of renewable energy sources
add a comment
First time here? We are a friendly community of Power Systems Engineers. Check out the FAQ!
i want to know how can i plot Rocof to study the effect of low inertia in a power system with hight integration of renewable energy sources
Thanks for your help so i have to try to download PSSPLT to be able to do that is it available online ?
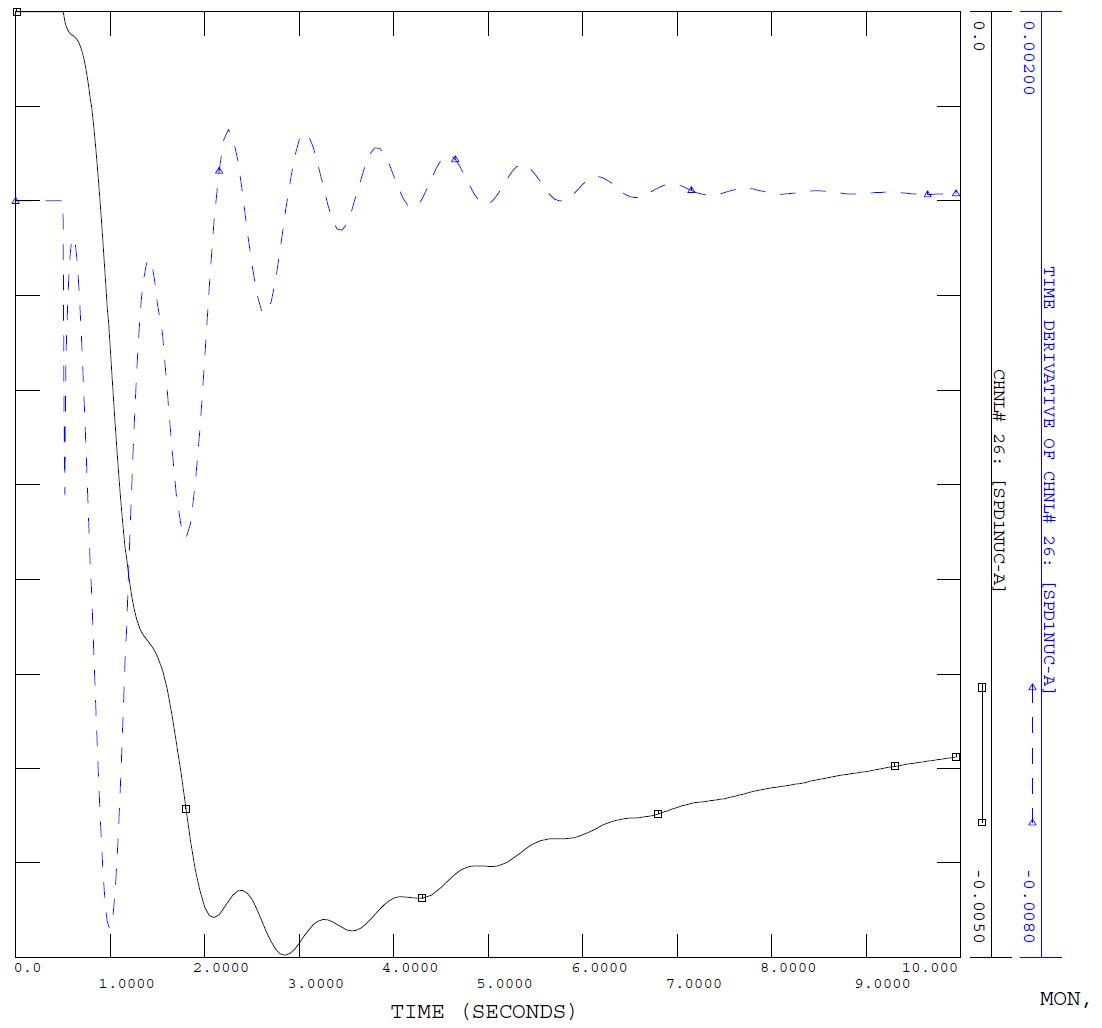
The rate of change of frequency can be plotted in the old plot program, PSSPLT, by selecting function # 17 "time derivative".
Below I plot the frequency and the ROCOF for the speed of machine 101 NUC-A in savnw network after trip a machine 3011.

Asked: 2021-05-10 07:39:52 -0500
Seen: 472 times
Last updated: May 11 '21
How to use Python do such a simulation on PSSE?
Exporting PV curve data from PSS/E to excel
How to get psse output to Excel?
Power flowing in opposite direction
How to solve this problem of wind generator
CMLDxxU2 and CMLDxxDGU2 modeling
PSSE crash after trying to install some python libraries
Equivalent two-phase to ground fault admittances at Transmission nodes
Import psspy returns error: DLL load failed
When i run ASCC fault calculation PSS/e crash down and restart without any results
 whit loves you. Content on this site is licensed under a Creative Commons Attribution Share Alike 3.0 license.
