How can i determine ROCOF in multi machines power system using PSS/E ?
i want to know how can i plot Rocof to study the effect of low inertia in a power system with hight integration of renewable energy sources
add a comment
First time here? We are a friendly community of Power Systems Engineers. Check out the FAQ!
i want to know how can i plot Rocof to study the effect of low inertia in a power system with hight integration of renewable energy sources
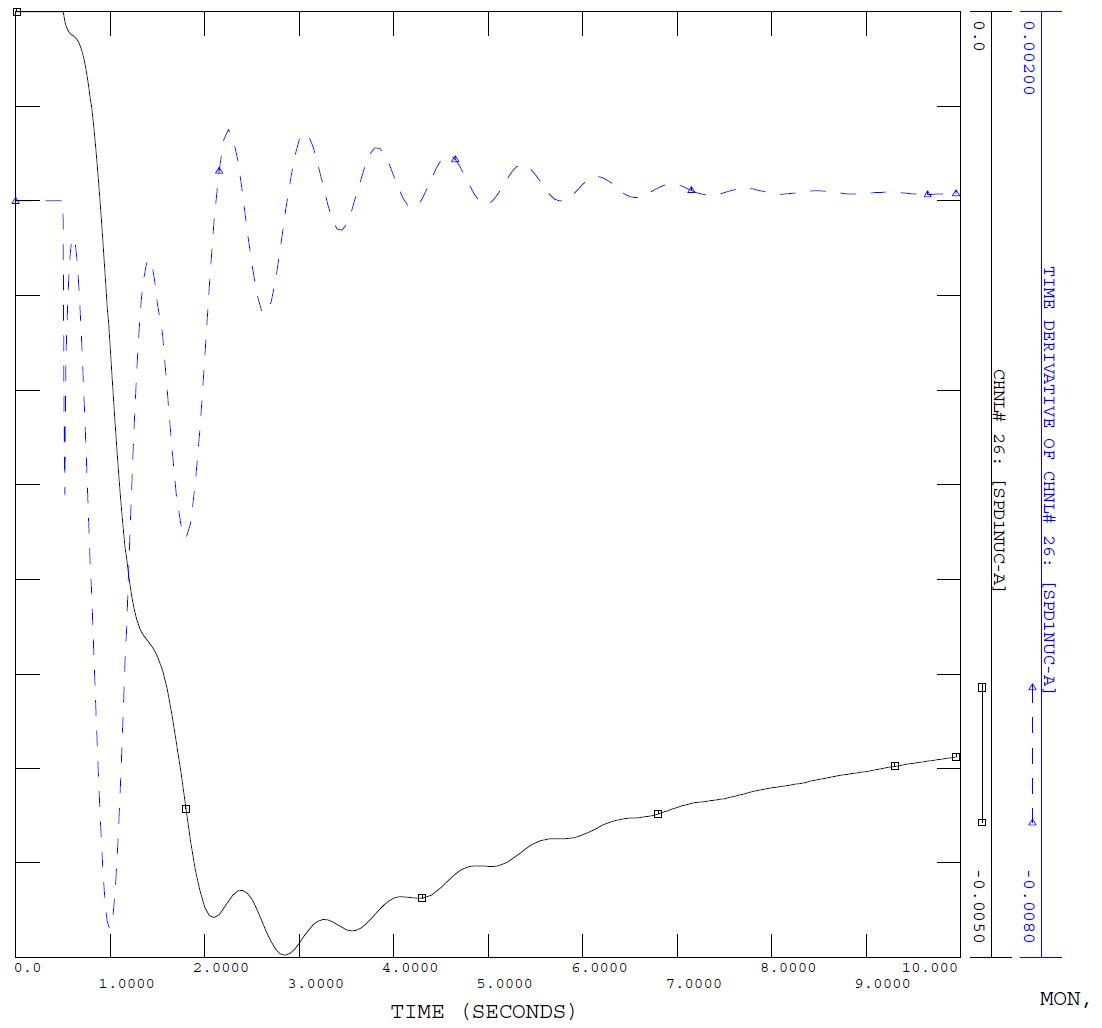
The rate of change of frequency can be plotted in the old plot program, PSSPLT, by selecting function # 17 "time derivative".
Below I plot the frequency and the ROCOF for the speed of machine 101 NUC-A in savnw network after trip a machine 3011.
Thanks for your help so i have to try to download PSSPLT to be able to do that is it available online ?

Asked: 2021-05-10 07:39:52 -0500
Seen: 1,054 times
Last updated: May 11 '21
How to see the generated equivalent model in PSSE?
What is the diffrence between REGCAU1 generator model and WT3G1 ?
How to Model Solar Battery Storage System in PSSE?
How to find the generator (fuel) type in the PSS E Model?
What model can make the CBEST model achieve frequency control power output?
PSSe Results to Excel: Results to different Column
Momentary Cessation Capability in 2nd Gen Renewable Models
How can you edit branch data from PSSE raw file using Python? [closed]
 whit loves you. Content on this site is licensed under a Creative Commons Attribution Share Alike 3.0 license.
