How can i determine ROCOF in multi machines power system using PSS/E ?
i want to know how can i plot Rocof to study the effect of low inertia in a power system with hight integration of renewable energy sources
add a comment
First time here? We are a friendly community of Power Systems Engineers. Check out the FAQ!
i want to know how can i plot Rocof to study the effect of low inertia in a power system with hight integration of renewable energy sources
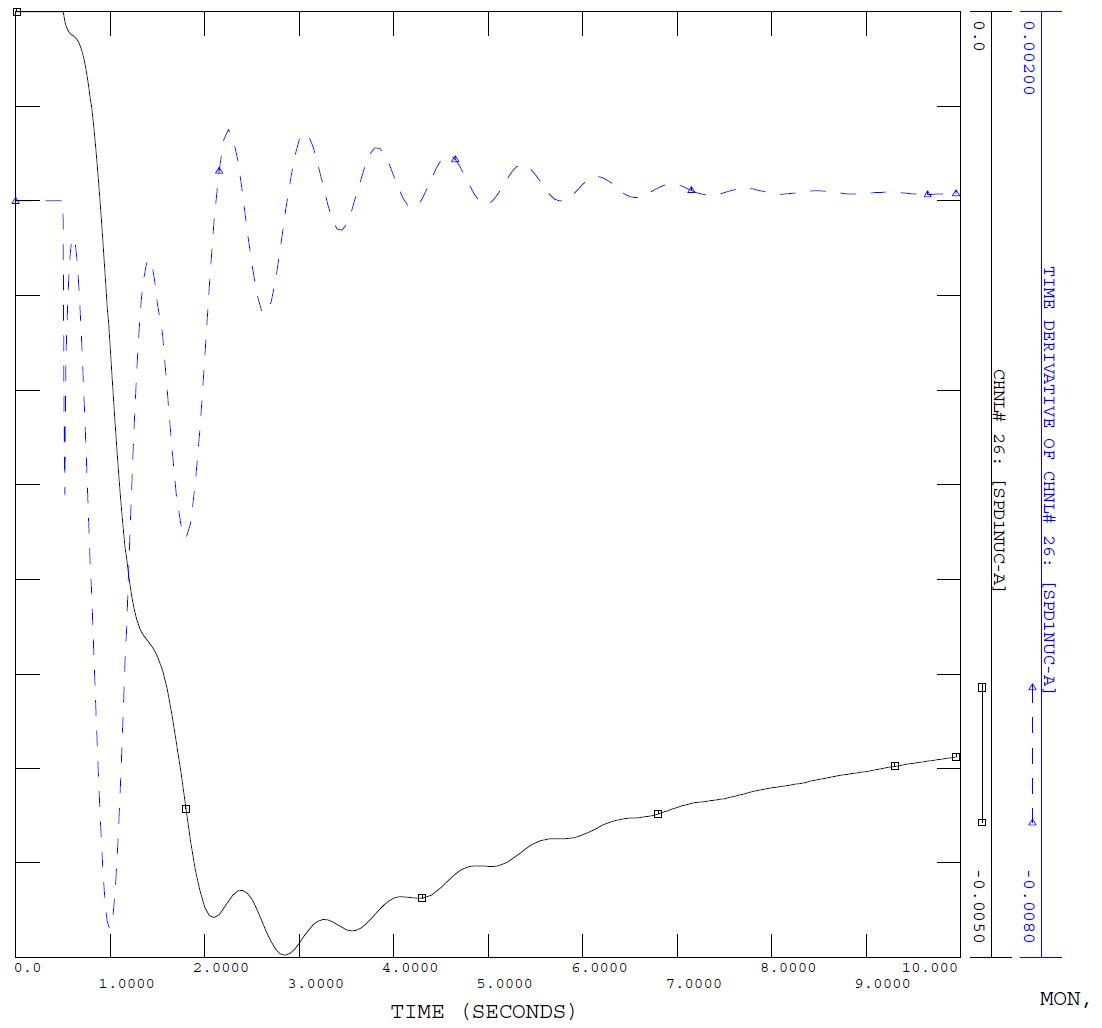
The rate of change of frequency can be plotted in the old plot program, PSSPLT, by selecting function # 17 "time derivative".
Below I plot the frequency and the ROCOF for the speed of machine 101 NUC-A in savnw network after trip a machine 3011.
Thanks for your help so i have to try to download PSSPLT to be able to do that is it available online ?

Asked: 2021-05-10 07:39:52 -0500
Seen: 1,054 times
Last updated: May 11 '21
How to see the generated equivalent model in PSSE?
renewable generation not shown in load flow
What is the diffrence between REGCAU1 generator model and WT3G1 ?
How to Model Solar Battery Storage System in PSSE?
Using MODULE EXCELPY to READ data
What model can make the CBEST model achieve frequency control power output?
PSSe Results to Excel: Results to different Column
 whit loves you. Content on this site is licensed under a Creative Commons Attribution Share Alike 3.0 license.
