First time here? We are a friendly community of Power Systems Engineers. Check out the FAQ!

Ask Your Question
0

How to plot governor response

asked Sep 7 '4

erika gravatar image

Hello, I am trying to observe the governor response following a generation loss event of around 2000 MW. for this at first I sum up all the PELEC of all the generators(except the unit which tripped) in no-fault condition and get a curve of the accumulated PELEC. then I create that generation loss event and sum up the PELEC of all the generators again (except the unit which tripped) and get a curve of the accumulated PELEC. Then I subtract the old curve from this new curve to get the governor response. But thing is that the governor response is too high. For the loss of 2000 MW, I am getting governor response of 80,000 MW. So I assume I did any mistake in the procedure. So what should be the correct way to plot governor response?

1 answer

Sort by » oldest newest most voted
0

answered Sep 7 '4

perolofl gravatar image

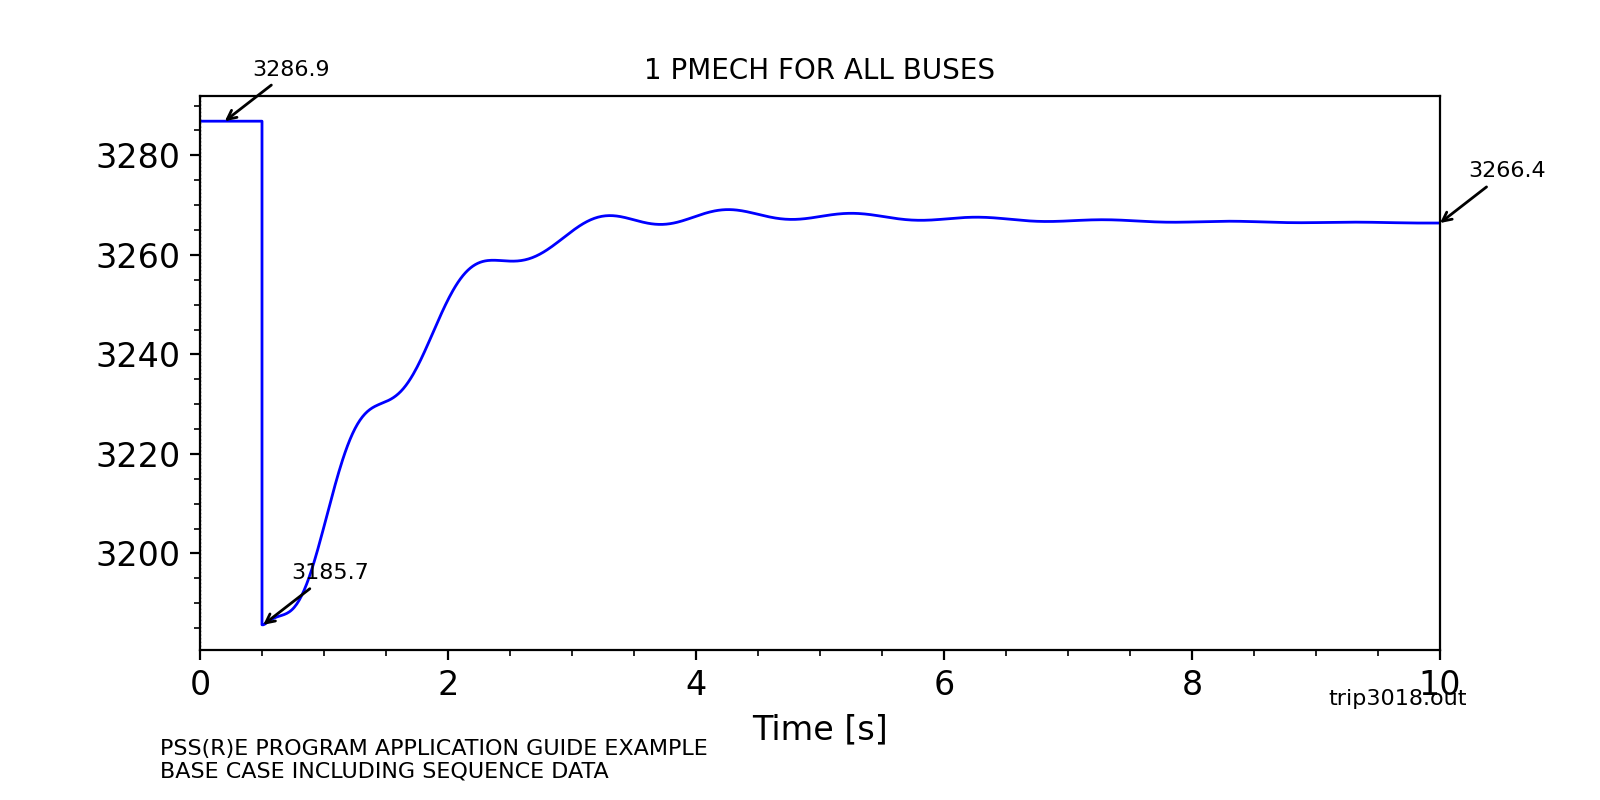
Select Subsystem Power Total for All Buses. This will add five channels with total PMECH, PELEC, PACCEL, PLOAD and PE-PL for all generators. Channel PMECH FOR ALL BUSES shows the the total turbine power in MW.

An example with trip og generator 3018 in savnw network: image description

After trip of generator 3018 the total PMECH is 3185.7 MW. At the new steady state the turbine power is 3266.4 MW. The total governor response is 3266.4-3185.7 = 80.7 MW.

link

Your Answer

Please start posting anonymously - your entry will be published after you log in or create a new account.
Want to format code in your answer? Here is a one minute demo on Youtube

Add Answer

[hide preview]

Question Tools

2 followers

Stats

Asked: Sep 7 '4

Seen: 109 times

Last updated: Sep 07 '24