Ask Your Question
0

How to plot the whole system's frequency response in a single curve in PSSE?

asked 2018-09-17 23:06:59 -0500

Oridroo gravatar image

Dear All,

I have been trying to analyse the frequency response of a power system, especially after adding solar generators.

Now I want to plot the overall system's frequency response in a single curve but I am not getting that option in PSSE's 'Define Simulation Output (CHAN)' option. There I can plot the frequency responses of individual buses.

Any suggestion would be much appreciated. Please give me the detail guideline.

Regards

edit retag flag offensive close merge delete

2 answers

Sort by » oldest newest most voted
0

answered 2018-09-18 03:52:06 -0500

perolofl gravatar image

updated 2018-09-18 10:10:03 -0500

I am not sure what you mean with overall system's frequnecy response. Is it the average frequency of all in-service generators? There is no such channel available in PSSE. The closest you can get is to add machine angle statistics to your channels and simulate without relative rotor angles, i.e. using absolute rotor angles (see Dynamic simulation options).

Then you can plot the derivative of the average rotor angle with PSSPLT (use FUNC and Time derivative). I show an example below where I tripped gen 3011 in savnw.sav network. Note that the unit is degrees/s and not Hz.

image description

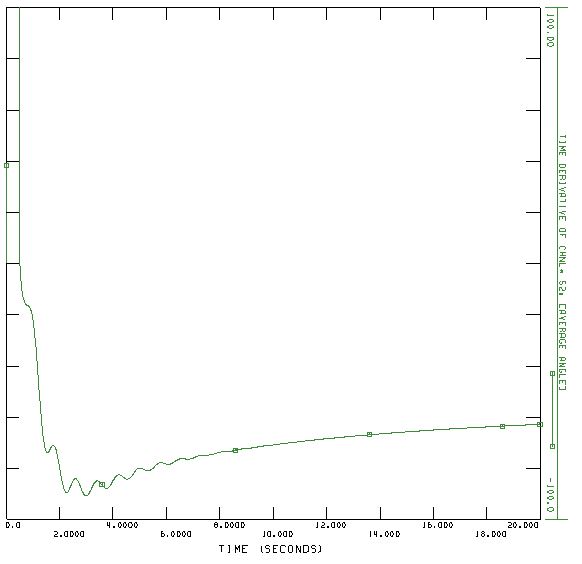
The plot is generatated with the following response file in order to plot the time derivative of channel 52:

CHNF
savnw_abs_angle_gtrip_3011.out
RANG
1
0
FUNC
17
SLCT
52
-100 100
0
POPT
0
PLOT,IN
26
FUNC
0
ECHO
@END

Note that there are some transients in the calculated curve at time 0 and at the time of generator tripping. Otherwise, the derivative is zero before tripping the generator.

This curve can be compared with the speed of generator at bus 101: image description

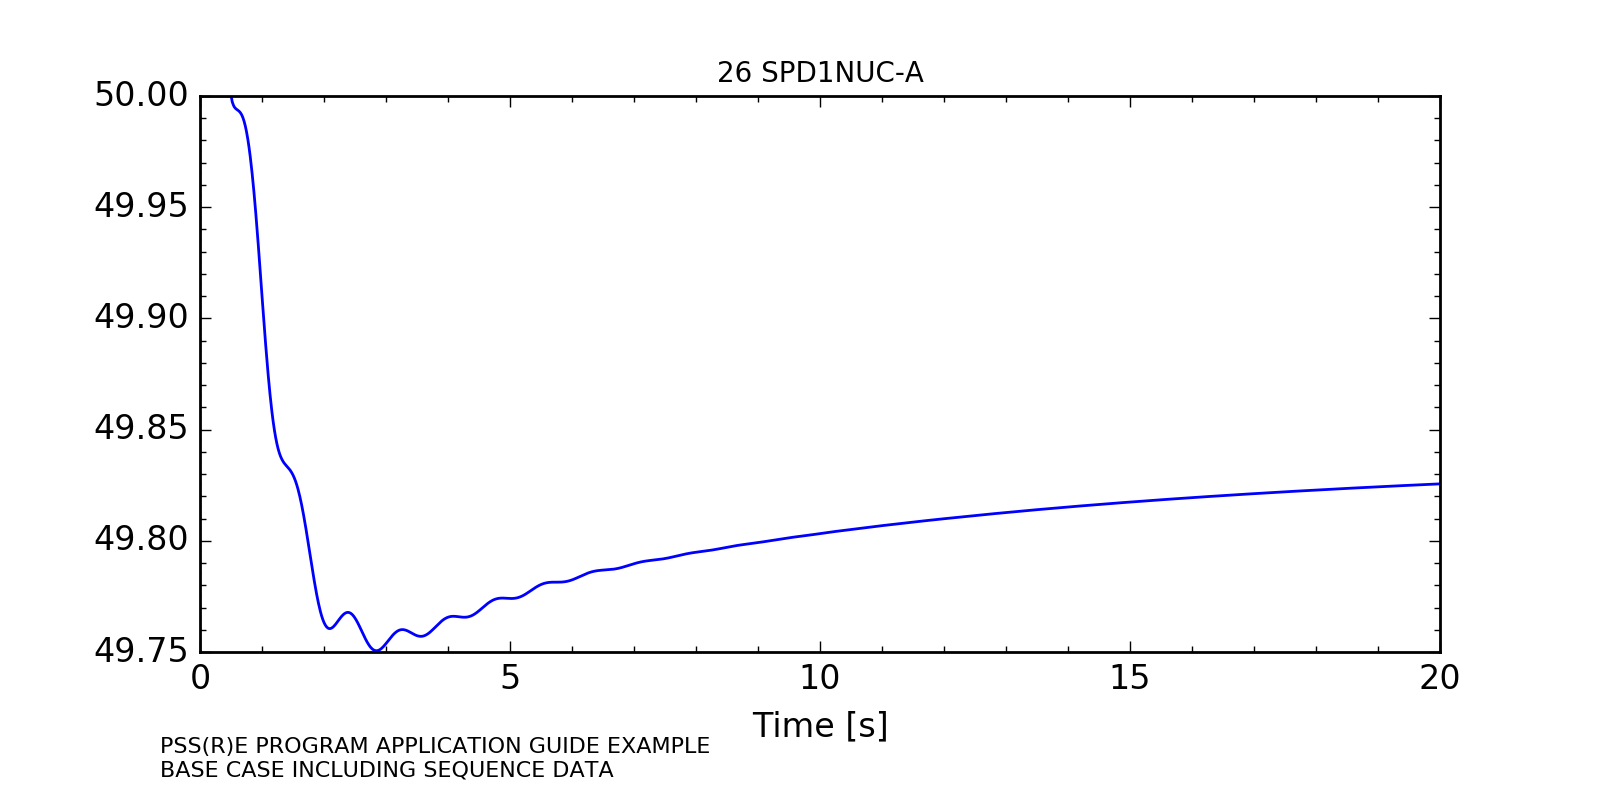
Here the base frequency for savnw is changed to 50 Hz. The two curves have a similar shape. The first one is depicting the average of all on-line generators.

edit flag offensive delete link more
0

answered 2018-09-18 04:10:09 -0500

Oridroo gravatar image

Hi, Thanks for your guideline. I have seen in a paper where the author had plotted the whole network's frequency response through a single curve. I will be attaching the image later as I don't have the required points to attach file.

Though the author used mathematical equation to calculate equivalent system frequency (in Hz) in terms of rated MVA,Inertia Constant and frequency of ith generator. For that calculation I need to know each generator's frequency which is not available at PSSE. I can only see bus frequency, not the machine frequency in PSSE.

In my system, I have 6 GENROE generators. I think I could not make my query clear. Please ask questions as I am not proficient with PSSE yet and lack knowledge in power system analysis as well.

edit flag offensive delete link more

Comments

Of course you can see the generator frequency in PSSE. That is what I plotted in my last curve. That signal is called speed and is in pu speed deviation. In my plot the signal is recalculated to Hz by 50*(1+spd).

perolofl gravatar imageperolofl ( 2018-09-18 04:17:16 -0500 )edit

So in the 'Dynamic Simulation Options', which option shall I choose at 'Set relative machine angles'? i) Relative to machine ii) Relative to system average angle iii) Relative to system weighted average angle

Oridroo gravatar imageOridroo ( 2018-09-18 04:27:16 -0500 )edit

None of them, disable the calculation of relative machine angles. That means that the absolute angles will be stored in the rotor angle channels.

perolofl gravatar imageperolofl ( 2018-09-18 04:36:13 -0500 )edit

Yes, that option is disabled. Now can you please tell me that how to plot the derivative of the average rotor angle with PSSPLT using FUNC and Time derivative? I tried looking for the PSSPLT in the PSSE doc but couldn't get enough direction. And your second plot is 'Bus Frequency', right?

Oridroo gravatar imageOridroo ( 2018-09-18 05:02:48 -0500 )edit

I have shown the needed commands in PSSPLT in my updated answer. My second plot is showing the rotor speed in Hz for machine 1 at bus 101, not the bus frequency.

perolofl gravatar imageperolofl ( 2018-09-18 10:12:22 -0500 )edit

Your Answer

Please start posting anonymously - your entry will be published after you log in or create a new account.

Add Answer

[hide preview]

Question Tools

2 followers

Stats

Asked: 2018-09-17 23:06:59 -0500

Seen: 2,117 times

Last updated: Sep 18 '18