Frequency zero
Hello, during simulation, frequency is constant (60hz) but when i plot it i see 0. Why?
add a comment
First time here? We are a friendly community of Power Systems Engineers. Check out the FAQ!
Hello, during simulation, frequency is constant (60hz) but when i plot it i see 0. Why?
i believe you can add a function. the formula is A*(60)+60, A being the %/P.U plot for Frequency.
In PSSE the machine speed is given in pu speed deviation, i.e. Hz/fbase - 1. The frequency base is either 50 or 60 Hz.
At nominal speed the pu speed deviation is 0. The speed deviation is positive at overfrequency and negative at underfrequency.
The formula to calculate the frequency in Hz is fbase*(spd+1).
You have to apply a formula to plot the rotor speed in Hz. You can do that in PSSLT with activity FUNC, as jconto described. Another alternative is to use a function in Plotbook, see example below:
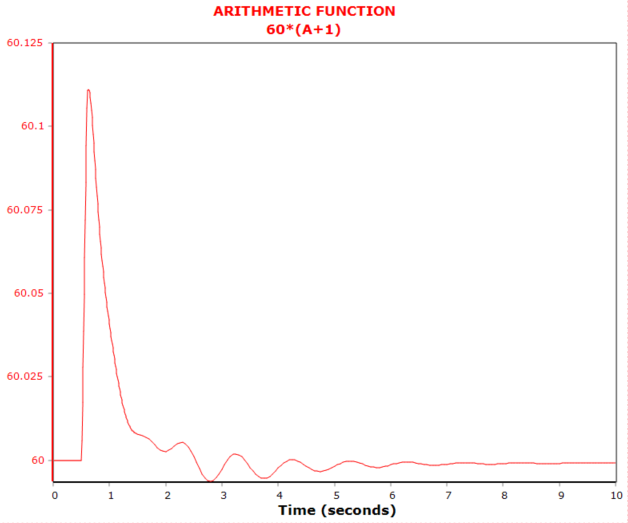
Here, A is a speed channel with machine pu speed deviation.
Personally, I prefer to read the outfile with dyntools.CHNF() and plot the channels with matplotlib. Then I can calculate the frequency in Hz for all spd-channels before plotting.
Check the post "How to change freq plots"

Asked: 2022-03-18 03:02:56 -0500
Seen: 1,083 times
Last updated: Mar 22 '22
 whit loves you. Content on this site is licensed under a Creative Commons Attribution Share Alike 3.0 license.
