Ask Your Question
1

Question on plotting using plot book and tree view

asked 2025-02-04 18:05:20 -0600

marvin gravatar image

Hi there, everyone!

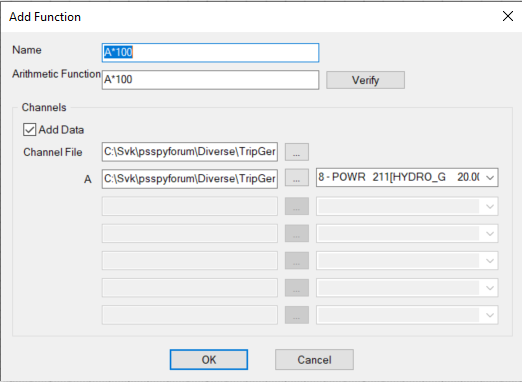
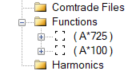
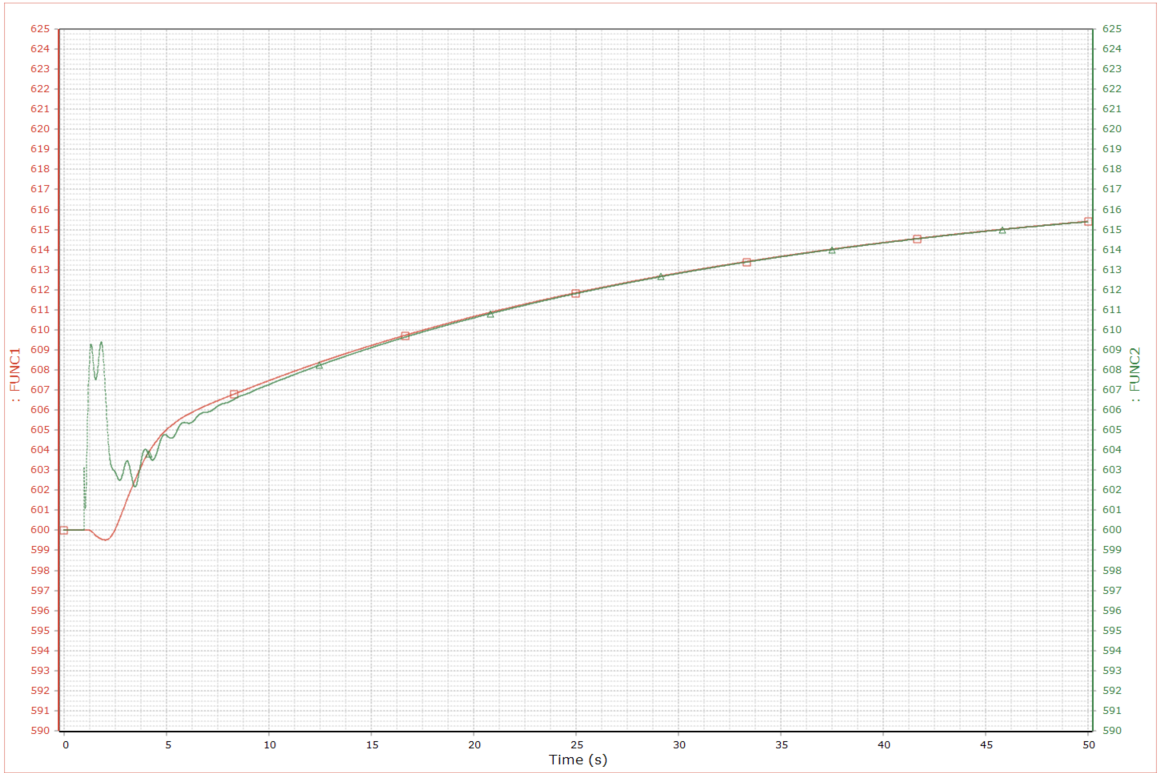
im new in PSSE and still not fully knowledgable in using python. I'm currently using version 35.6.4 and I want to plot results of dynamic simulation from an .out file. when simply dragging the channel to the plot area, the curve is generated. however, my problem is that when using functions to modify the results such as converting the result to nominal values instead of per unit values, the plot/curve is not showing in the plotbook. has anybody experienced the same?

Also, what is your recommended PSSE version?

Thank you!

edit retag flag offensive close merge delete

1 answer

Sort by ยป oldest newest most voted
1

answered 2025-02-05 06:47:11 -0600

perolofl gravatar image

I am normally not using Plotbook for plotting of out-files, but the following works for me:

Example, plotting Pmech and Pelec in MW for generator at bus 206 in savnw network. Mbase is 725 MVA.

Define two functions:

1: Multiply Pmech with Mbase: A*725

2: Multiply Pelec with Sbase: A*100

First function:

image description

Second function:

image description

The two defined functions in Plot Tree:

image description

Drag and drop the two functions in the Plot Page and adjust the scales:

image description

A is channel 33 in first function and channel 8 in second function.

edit flag offensive delete link more

Comments

Thank you very much for your time :) however, I still cannot make the plotbook to work. after adding the function, no plot is being displayed after being dragged and dropped in the plotting area. I'm guessing its a version bug , maybe. May I ask what version did you use for this one?

marvin gravatar imagemarvin ( 2025-02-05 17:30:12 -0600 )edit

Version 35.6.0

perolofl gravatar imageperolofl ( 2025-02-06 00:14:58 -0600 )edit

I see. My issue may be version-related. Thank you very much! :) btw, if you don't usually use plotbook, what method are you using?

marvin gravatar imagemarvin ( 2025-02-09 17:31:03 -0600 )edit

I am plotting all simulations with matplotlib instead.

perolofl gravatar imageperolofl ( 2025-02-09 23:36:57 -0600 )edit

I see. That I need to learn. Thank you very much! :)

marvin gravatar imagemarvin ( 2025-02-09 23:39:52 -0600 )edit

Your Answer

Please start posting anonymously - your entry will be published after you log in or create a new account.

Add Answer

[hide preview]

Question Tools

1 follower

Stats

Asked: 2025-02-04 18:05:20 -0600

Seen: 120 times

Last updated: Feb 05