How can i plot short circuit current Iccafter performing dynamic simulation ?
I am currently using the PSS/E 33.4 version and i am simulating the IEEE 9 bus system i want to visualise the short circuit current after dynamic simulation.
add a comment
First time here? We are a friendly community of Power Systems Engineers. Check out the FAQ!
I am currently using the PSS/E 33.4 version and i am simulating the IEEE 9 bus system i want to visualise the short circuit current after dynamic simulation.
The problem here is that PSSE doesn't have any channel for fault current monitoring, or not even to plot a branch current.
However, the fault current can be plotted with the following method:
Split the faulted bus, in my example bus 154 in savnw network is split and a zero impedance line (ZIL) is inserted to the new bus 254.
Add a branch-MVA channel for the line between bus 154 and 254. Add a bus voltage channel for bus 154.
Perform a dynamic simulation and apply the fault at the new bus, 254. The total fault current will then go through the branch from bus 154 to 254.
After simulation, use a formula to plot the following: branchMVA / (Vpu*Vbase) / sqrt(3). In the following example the fault is applied at time = 0.5 and cleared at time = 0.6 s. The curve shows the bus fault current, i,e, the current flowing through line 154 - 254.
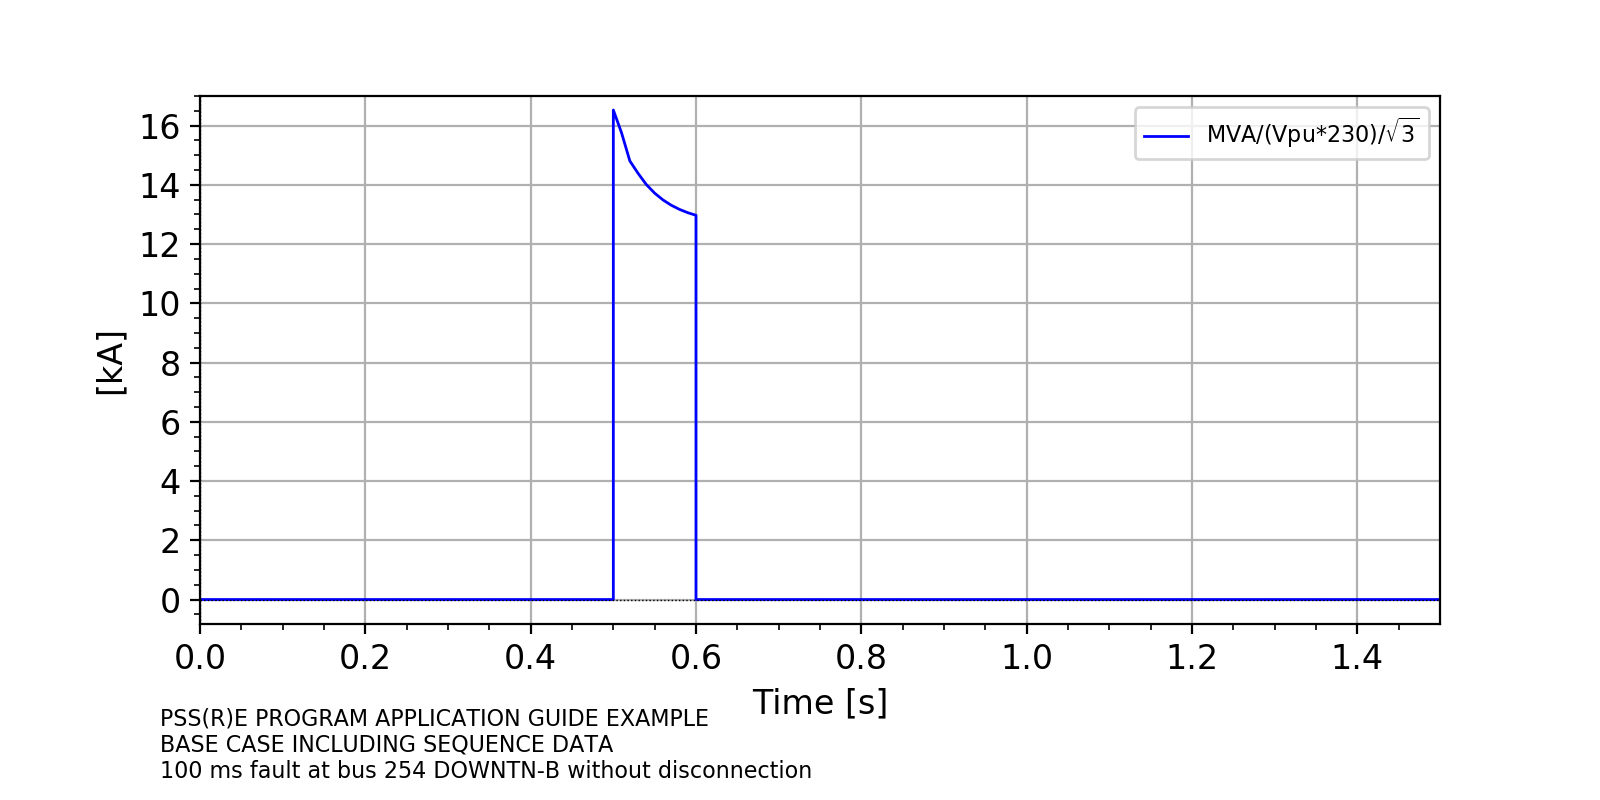
The inital fault current is above 16.5 kA and the current declines during the fault to about 13 kA.
A set of channels (a.k.a study variables) can be plotted within the PSSe GUI after opening an OUT file. The plotting features are still crude but its drag-and-drop feature is very useful. You can also use PSSPLT, a tool in the PSSe installation to do plotting. Check its manual and search for it on this forum. A channel data can be exported to excel and be plotted there. Check for "channel export" in the forum.
A python script to do plotting using the module dyntools (part of PSSe installation) is an option. Check the demo code 'dyntools_demo.py' available in the folder 'example', part of the PSSe installation.
About the case IEEE9bus system, search the forum for "Does anyone have IEEE 9 and IEEE39 dyr files?" where a link will take you to my public google site. The updated IEEE9bus system contains scripts to run fault runs (with composite load models) and simple script-driven plotting. You may check "channels.py", my other tool for plotting.

Asked: 2022-03-09 06:56:26 -0500
Seen: 285 times
Last updated: Mar 15 '22
PSSE Dynamic Simulation parameters
Can someone share the original IEEE 14,24 or 39 bus systems data?
i want convert pss/E file to Digsilent
How can you interpret a .acc file from PSSE and extract useful data?
I want to use user-defined model with fortran
 whit loves you. Content on this site is licensed under a Creative Commons Attribution Share Alike 3.0 license.
