Curve doesn't start from t = 0s
Hello, I'm using PSS/e ver 33. And when I run simulation, the curve in the plot doesn't start from 0s. I don't know how to solve this problem. Please help me with this, I've been facing it for a long time. Thank you!
First time here? We are a friendly community of Power Systems Engineers. Check out the FAQ!
Hello, I'm using PSS/e ver 33. And when I run simulation, the curve in the plot doesn't start from 0s. I don't know how to solve this problem. Please help me with this, I've been facing it for a long time. Thank you!
I believe you are changing the output file name during the dynamic simulation. I give an example below:
psspy.strt_2([0,1],r"""file2""")
psspy.run(0, 0.5,0,1,0)
psspy.dist_bus_fault(151,1,0.0,[0.0,-0.2E+10])
psspy.run(0, 0.6,0,1,0)
psspy.change_channel_out_file('file3')
psspy.dist_clear_fault(1)
psspy.run(0, 2.0,0,1,0)
Here, the API change_channel_out_file changes the name of the output file at t=0.6 s.
The resulting plot of output file2.out is:
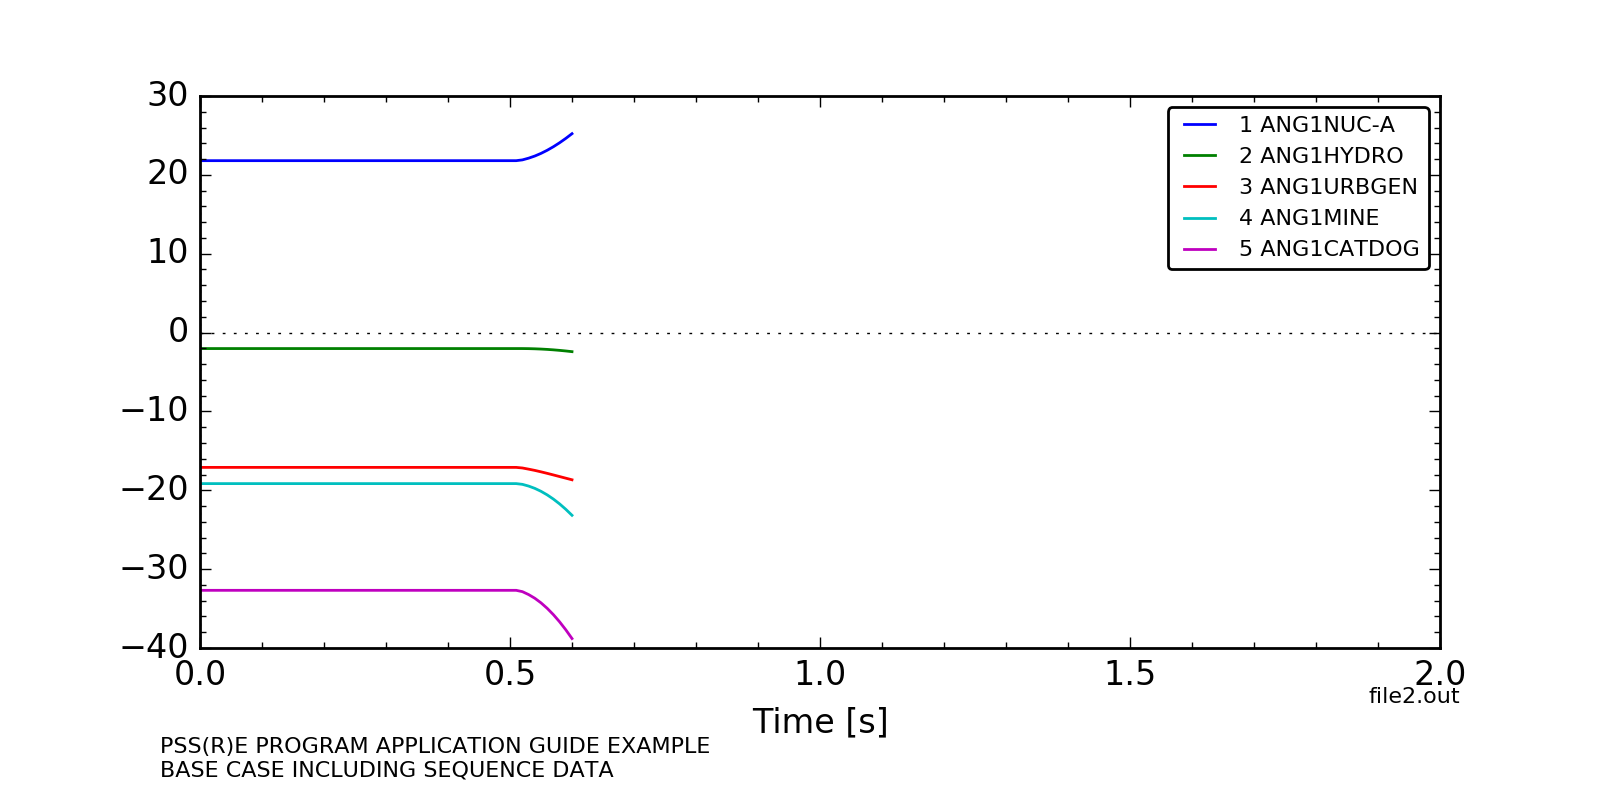
I.e., file2.out only contains the results up to t=0.6 s.
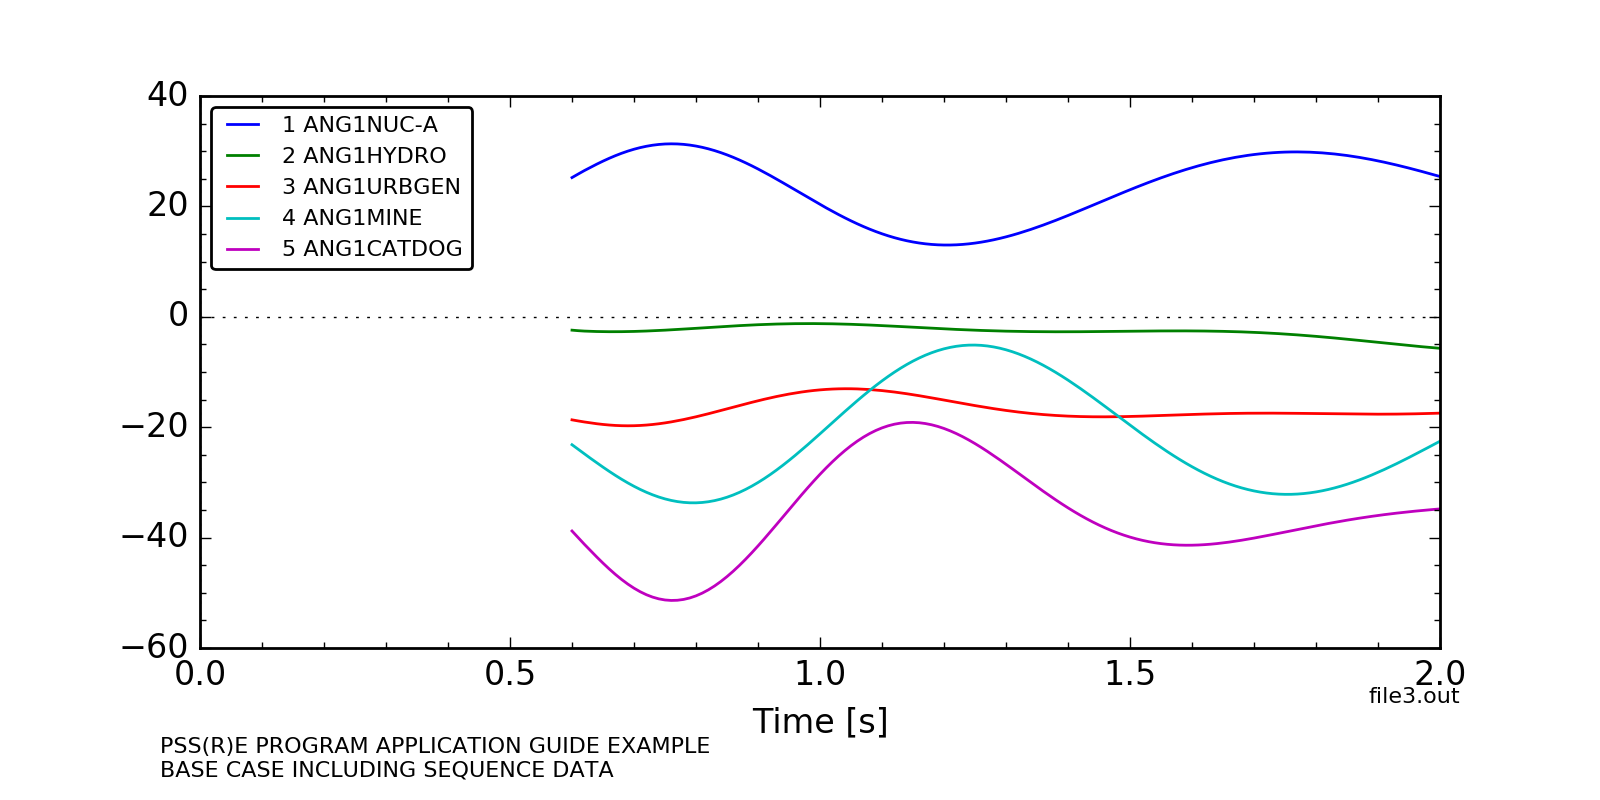
File file3.out contains the simulation results from time t=0.6 and the plot is shown below:
The output file name shall be defined at strt and not changed during the simulation. So, make sure API change_channel_out_file is not used in your code.
Did you import your dynamic file from a .dyr file or a .snp file? If from a .snp file then your initial starting point was saved at a location other than 0s after initialization.
I did create new .dyr and .out files, but the results didn't change.

Asked: 2021-02-04 08:09:51 -0500
Seen: 442 times
Last updated: Feb 05 '21
 whit loves you. Content on this site is licensed under a Creative Commons Attribution Share Alike 3.0 license.

Where does your curve start?
It starts from t = 1s