Revision history [back]
 | 1 | initial version |
I am not sure what you mean with overall system's frequnecy response. Is it the average frequency of all in-service generators? There is no such channel available in PSSE. The closest you can get is to add machine angle statistics to your channels and simulate without relative rotor angles, i.e. using absolute rotor angles (see Dynamic simulation options).
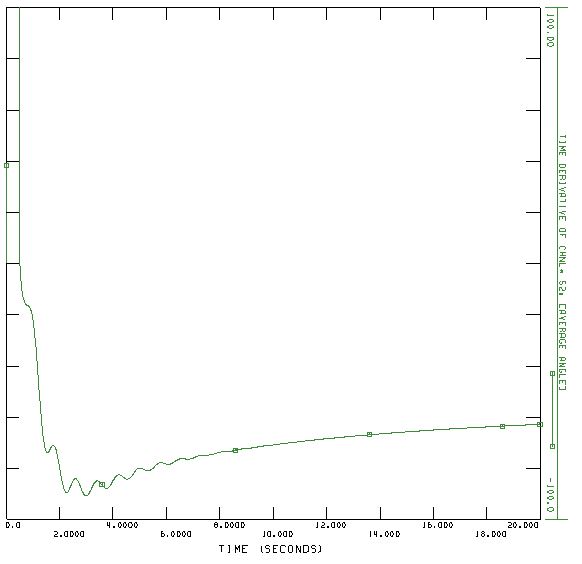
Then you can plot the derivative of the average rotor angle with PSSPLT (use FUNC and Time derivative). I show an example below where I tripped gen 3011 in savnw.sav network. Note that the unit is degrees/s and not Hz.

Note that there are some transients in the calculated curve at time 0 and at the time of generator tripping. Otherwise, the derivative is zero before tripping the generator.
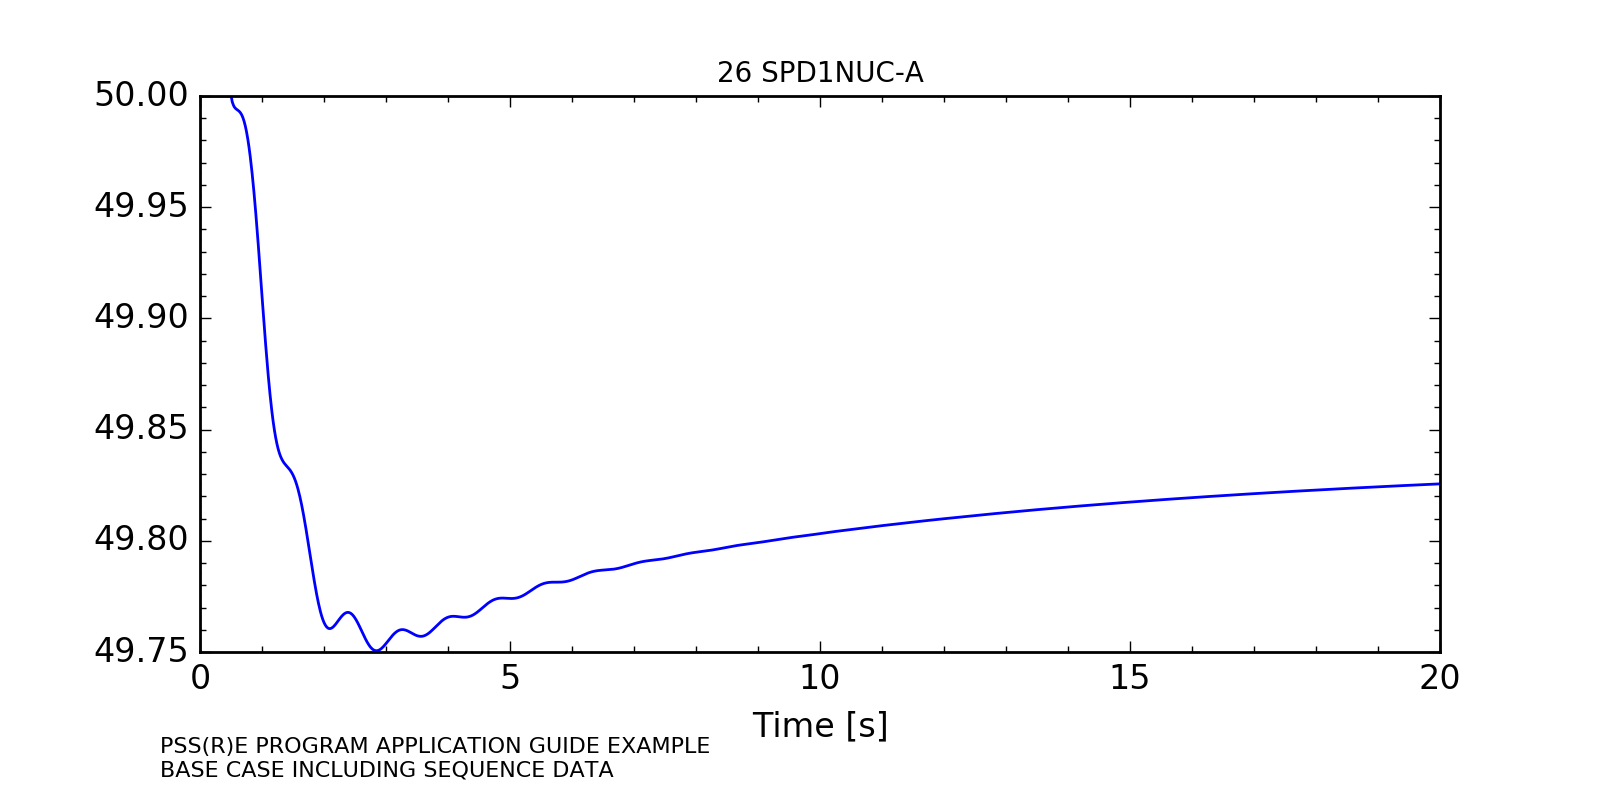
This curve can be compared with the speed of generator at bus 101:

Here the base frequency for savnw is changed to 50 Hz. The two curves have a similar shape. The first one is depicting the average of all on-line generators.
 | 2 | No.2 Revision |
I am not sure what you mean with overall system's frequnecy response. Is it the average frequency of all in-service generators? There is no such channel available in PSSE. The closest you can get is to add machine angle statistics to your channels and simulate without relative rotor angles, i.e. using absolute rotor angles (see Dynamic simulation options).
Then you can plot the derivative of the average rotor angle with PSSPLT (use FUNC and Time derivative). I show an example below where I tripped gen 3011 in savnw.sav network. Note that the unit is degrees/s and not Hz.
Hz.

Note that there are some transients in the calculated curve at time 0 and at the time of generator tripping. Otherwise, the derivative is zero before tripping the generator.
This curve can be compared with the speed of generator at bus 101:

Here the base frequency for savnw is changed to 50 Hz. The two curves have a similar shape. The first one is depicting the average of all on-line generators.
 | 3 | No.3 Revision |
I am not sure what you mean with overall system's frequnecy response. Is it the average frequency of all in-service generators? There is no such channel available in PSSE. The closest you can get is to add machine angle statistics to your channels and simulate without relative rotor angles, i.e. using absolute rotor angles (see Dynamic simulation options).
Then you can plot the derivative of the average rotor angle with PSSPLT (use FUNC and Time derivative). I show an example below where I tripped gen 3011 in savnw.sav network. Note that the unit is degrees/s and not Hz.

The plot is generatated with the following response file in order to plot the time derivative of channel 52:
CHNF
savnw_abs_angle_gtrip_3011.out
RANG
1
0
FUNC
17
SLCT
52
-100 100
0
POPT
0
PLOT,IN
26
FUNC
0
ECHO
@END
Note that there are some transients in the calculated curve at time 0 and at the time of generator tripping. Otherwise, the derivative is zero before tripping the generator.
This curve can be compared with the speed of generator at bus 101:

Here the base frequency for savnw is changed to 50 Hz. The two curves have a similar shape. The first one is depicting the average of all on-line generators.

