Revision history [back]
| | 1 | initial version |

Example: Branch 154 - 205 in savnw.sav network.
Rate A: 600 MVA, flow -354.2 MW -j251.5 Mvar = 434.4 MVA.
When "Non transformer percent units" in Program Setting is chosen to "MVA", the percent loading is 434.4/600 = 72.4%.
The voltage at bus 154 is 0.9389 pu.
When "Non transformer percent units" in "Program Settings" is chosen to "Current expressed as MVA", the percent loading is 434.4/600/0.9389 = 77.1%.
The selection in "Program Settings" determines the unit for loading percentage (MVA or current) used in Reports like POUT etc.
Slider diagrams have their own setting of the option in "Diagram Properties - Diagram annotation". However, there is a severe bug in Slider diagrams. The wrong option is shown in the diagram:
With MVA option:
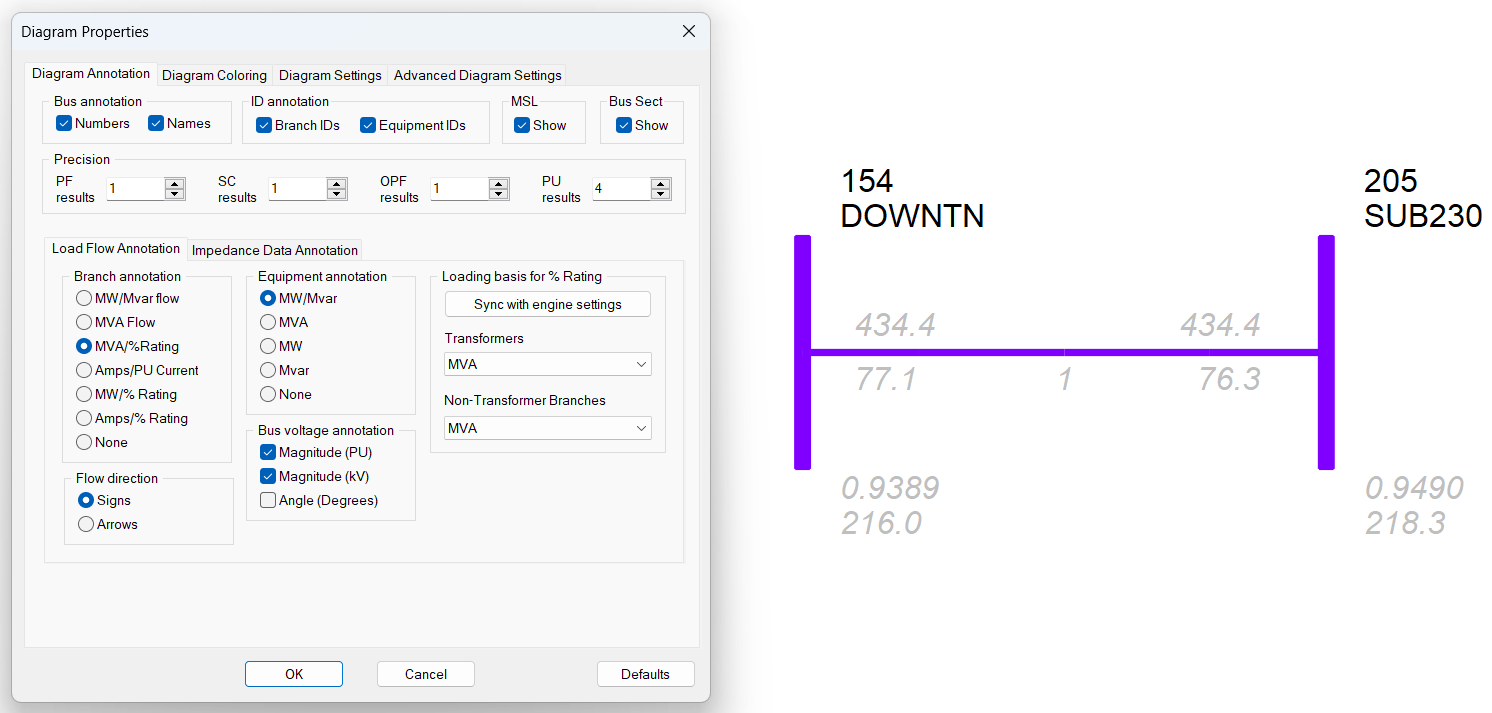
Here the current loading (77.1%) is displayed instead of MVA loading!
With Current option:
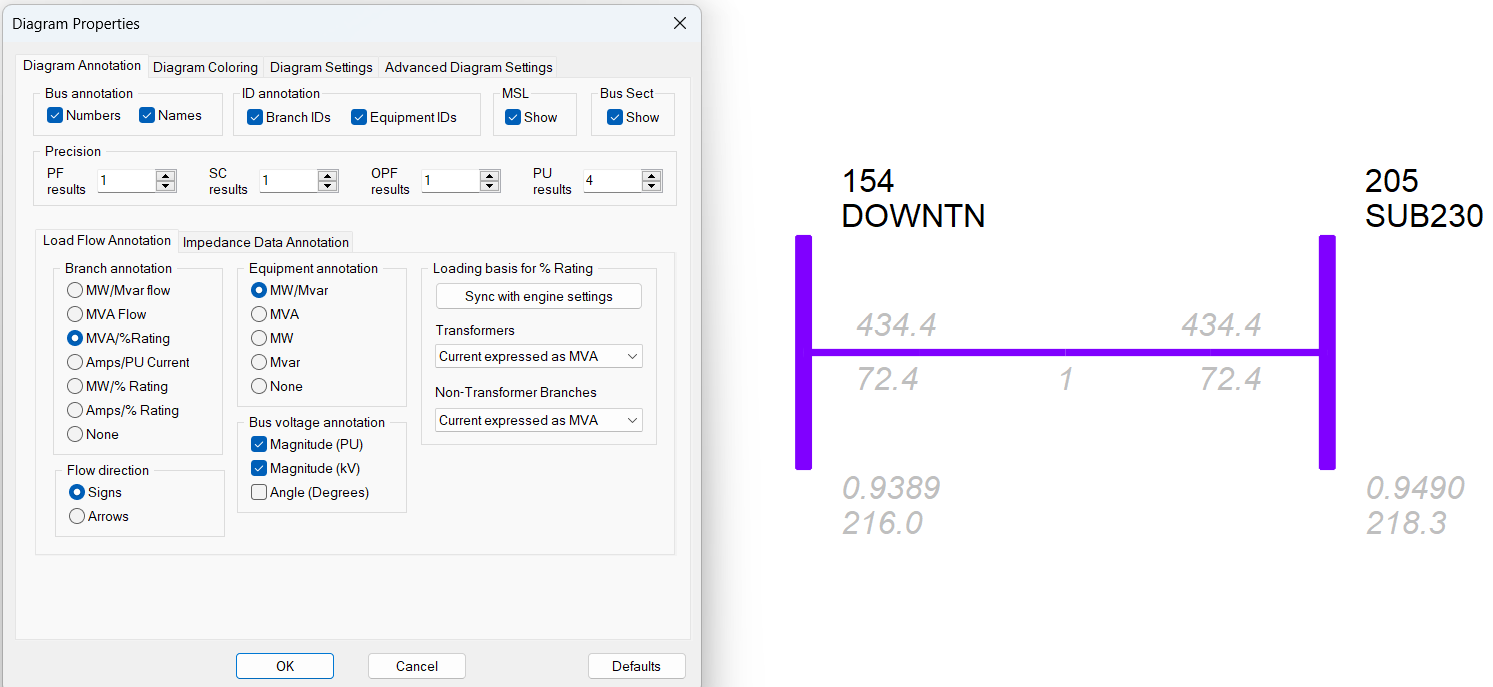
Here the MVA loading (72.4%) is displayed instead of current loading.
The conclusion is to choose the wrong (opposite) option in "Diagram Properties" to get the correct loading information in Slider diagrams.
The bug has been reported to Siemens PTI and will be corrected in the next release.
It is the same bug for transformer.
